

ESG Report Design Trends Singapore Companies Need For Modern Disclosure
ESG report design trends singapore companies should understand are no longer limited to colour palettes, cover concepts, and page decoration. Modern sustainability reporting is becoming more data-driven, stakeholder-focused, digitally accessible, and closely connected to corporate credibility. Companies need ESG reports that can communicate complex environmental, social, and governance information clearly while still presenting a professional brand image. This is why the latest ESG design trends focus on structure, readability, data storytelling, accessibility, digital adaptability, and evidence-based communication.
For Singapore corporates, sustainability report trends are shaped by both stakeholder expectations and reporting requirements. SGX states that sustainability reports should include primary components such as material ESG factors, climate-related disclosures, policies, practices and performance, targets, reporting framework, and board statement. This means design must support clear navigation, data explanation, governance visibility, and target tracking, not only visual appeal.
Another important driver is the growing focus on climate-related disclosure. ACRA’s sustainability reporting roadmap confirms that Scope 1 and Scope 2 greenhouse gas emissions reporting applies from FY2025 for all listed companies, with additional ISSB-based climate-related disclosure timelines varying by company category. This makes ESG innovation design more important because companies need layouts that explain emissions, climate risks, reporting boundaries, and progress without overwhelming readers.
Reporting design trends are also moving toward digital-first experiences. Stakeholders may read ESG content through PDFs, corporate websites, investor pages, interactive dashboards, presentation decks, or mobile devices. This means report design should be searchable, accessible, screen-friendly, and easy to repurpose. WCAG 2.2 provides recommendations for making web content more accessible, which is relevant when ESG reports are published online or adapted into digital sustainability pages.
For brands such as alivea and companies seeking premium ESG communication, the opportunity is to move beyond conventional sustainability documents. A modern ESG report should help stakeholders understand what the company is doing, why it matters, how progress is measured, and what future direction has been set. The best ESG report design trends Singapore companies adopt are practical, credible, elegant, and built around trust.
ESG Report Design Trends Singapore Companies Use To Improve Transparency
ESG report design trends Singapore companies are adopting increasingly focus on transparency. In earlier reporting cycles, many sustainability reports relied heavily on long text blocks, generic nature imagery, and broad corporate statements. Today, stakeholders expect clearer evidence, measurable progress, and straightforward explanations. This shift is changing how ESG reports are designed from the first page to the final appendix.
One major trend is the use of structured executive summaries. Instead of opening with only a leadership message, companies now often include ESG highlights, key metrics, material topic summaries, reporting scope, and progress snapshots near the beginning. This helps readers understand the report’s main direction before reviewing detailed sections. For investors, board members, employees, customers, and partners, this structure makes the report easier to scan and more useful.
Another transparency-focused trend is the rise of performance dashboards. Environmental, social, and governance metrics can be presented through cards, charts, tables, icons, and progress indicators. A dashboard can show emissions, energy consumption, employee training, safety performance, diversity, community investment, supplier screening, governance policies, and target status in a concise format. Good ESG design trends do not use dashboards as decoration. They use them to make important information easier to evaluate.
Sustainability report trends also show stronger use of plain-language explanations. Complex topics such as Scope 1, Scope 2, Scope 3, materiality, climate transition risk, physical risk, and board oversight should not be hidden in technical language. Design can help by using glossary panels, callout boxes, definitions, footnotes, captions, and section introductions. This improves understanding without reducing professional quality.
ESG innovation design also supports transparency through better evidence mapping. When charts, claims, and targets are placed near explanatory content, readers can connect narrative and data more easily. Reporting design trends are therefore shifting away from disconnected storytelling and toward integrated disclosure. A transparent ESG report looks polished, but it also allows readers to verify meaning, compare progress, and understand the company’s accountability.
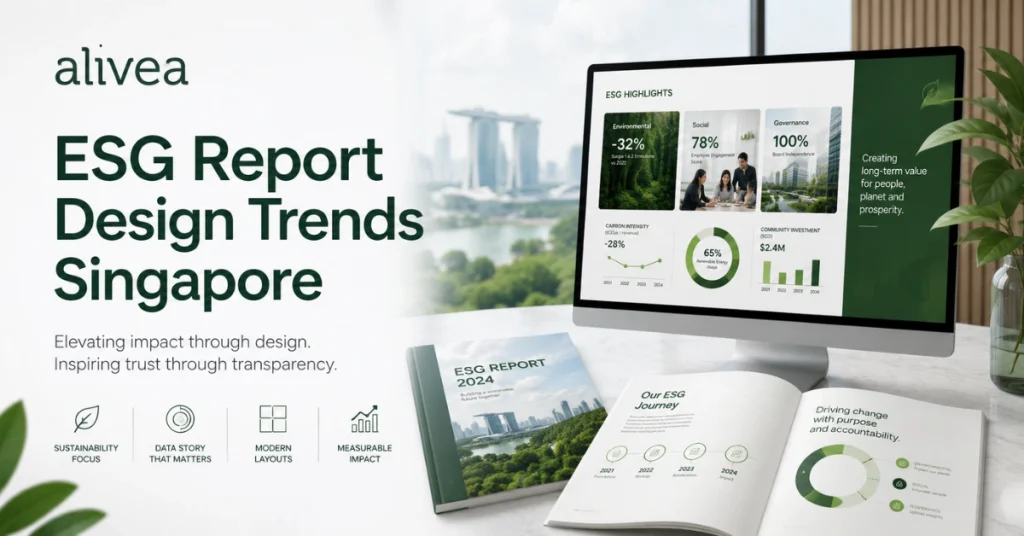
ESG Design Trends For Premium Layouts, Data Stories, And Brand Trust
ESG design trends are moving toward premium simplicity. The strongest ESG reports are not necessarily the most visually complex. They are the ones that make sustainability information clear, credible, and easy to navigate. For Singapore companies, this means using professional layouts that balance visual appeal with disclosure discipline. A report should look refined, but the design should never distract from the accuracy of the information.
One important trend is modular report design. Instead of creating pages from scratch one by one, designers build reusable content modules such as metric cards, chart blocks, case study panels, quote sections, governance diagrams, target trackers, and data tables. This makes the report more consistent and easier to update in future years. It also helps companies maintain a strong visual identity across annual reports, ESG reports, investor presentations, and website content.
Another trend is branded ESG storytelling. Many companies want their sustainability reports to feel aligned with their corporate identity rather than like generic ESG templates. This requires careful use of typography, colours, photography, illustration style, icon systems, and page rhythm. ESG report design trends Singapore companies can use should reflect the company’s sector, maturity, and stakeholder audience. A financial institution may need a precise, trust-focused visual style. A technology company may use more digital and innovation-led layouts. A real estate group may emphasize place, community, climate resilience, and long-term asset value.
Data storytelling is also becoming central to ESG design trends. A strong visual report should show not only what changed, but also why it changed and how the company is responding. For example, an emissions chart becomes more meaningful when paired with operational context. A workforce metric becomes more useful when linked to development initiatives. A governance diagram becomes more credible when connected to board oversight and management accountability.
Sustainability report trends are therefore moving away from surface-level “green” design. ESG innovation design now requires clarity, evidence, and brand trust. For alivea and corporates seeking premium sustainability communication, this means building reports that feel modern, responsible, and grounded in real performance.
Sustainability Report Trends For Digital-First And Stakeholder-Friendly Reports
Sustainability report trends increasingly point toward digital-first communication. While printed and downloadable PDF reports remain important, many stakeholders now access ESG information through websites, online investor relations pages, mobile screens, search engines, internal portals, and presentation decks. This changes how companies should plan, write, and design ESG reports.
A digital-first ESG report should be easy to navigate. Clickable tables of contents, section links, PDF bookmarks, clear page numbering, short chapter introductions, and consistent navigation tabs can help readers move through long documents. ESG report design trends Singapore companies should consider include screen-friendly typography, strong contrast, concise visual labels, and layouts that remain readable on laptops and tablets. A report that looks elegant in print but difficult on screen may not serve modern stakeholders effectively.
Another sustainability report trend is content repurposing. Companies are increasingly designing ESG reports as content systems rather than single documents. A materiality section can become a website summary. Climate charts can support investor presentations. Workforce stories can become employer branding content. Governance diagrams can be reused in board updates. This approach increases the value of ESG design because one reporting system can support multiple communication channels.
Digital accessibility is also becoming more important. When ESG reports are available online, companies should consider readability, contrast, document structure, searchability, and alternative text planning for web assets. WCAG 2.2 covers recommendations for making web content accessible to a wider range of users, which is relevant when ESG content is converted into digital experiences.
ESG innovation design also includes interactive possibilities. Some companies may use web-based dashboards, animated charts, sustainability microsites, or interactive report summaries. However, interactivity should not become a gimmick. It should help stakeholders understand data, compare results, or find information faster.
Reporting design trends are ultimately moving toward usability. A modern ESG report should be visually strong, but it should also be practical. Stakeholders should be able to search, scan, compare, download, share, and understand the report with minimal friction.
ESG Innovation Design For Interactive Data, Dashboards, And ESG Storytelling
ESG innovation design is changing the way companies communicate sustainability performance. Traditional ESG reports often followed a fixed linear format: leadership message, sustainability strategy, environment, social, governance, appendix. While that structure is still useful, modern reports are becoming more dynamic. Companies now need ways to present complex ESG data, stakeholder priorities, climate risks, targets, and progress in formats that feel clearer and more engaging.
One major innovation is the ESG dashboard. Dashboards can show performance against targets, year-on-year data, emissions trends, workforce indicators, governance controls, and stakeholder priorities. A dashboard works well because it gives readers a quick understanding of performance before they enter detailed sections. It can also help internal teams align around the same metrics used in external communication.
Another innovation is interactive data presentation. A digital ESG report may allow users to filter metrics by year, topic, business unit, or ESG category. This is useful for companies with large datasets. However, interactive design requires careful content governance. The numbers, definitions, and labels must remain consistent with the approved report. ESG report design trends Singapore companies use should enhance accuracy, not create confusion.
Sustainability report trends also include visual storytelling journeys. Instead of showing isolated initiatives, companies can design story flows that connect business context, ESG challenge, company action, measurable result, and future commitment. This approach works well for climate transition plans, community programmes, employee development, responsible procurement, and innovation projects.
Reporting design trends are also moving toward more refined visual systems. Rather than using random illustrations or generic environmental photos, companies can create original icon families, branded data styles, sustainability colour systems, and custom report templates. These design systems make reports more distinctive while keeping the content organized.
ESG innovation design is valuable when it improves understanding. The best innovation does not make reports unnecessarily flashy. It makes data more readable, strategies easier to follow, and stakeholder communication more useful. For premium corporate brands, innovation should feel purposeful, elegant, and trustworthy.
Reporting Design Trends For Clear Navigation, Accessibility, And Impact
Reporting design trends are increasingly shaped by the need for clarity. Corporate ESG reports can be long, technical, and data-heavy. Without strong navigation, readers may miss important information. A modern report should guide stakeholders through strategy, material topics, climate disclosure, performance data, social impact, governance, targets, and appendices in a logical way.
One trend is section-based navigation. Reports may use colour-coded tabs, chapter dividers, page markers, side labels, and summary pages to help readers understand where they are. This is especially useful for sustainability reports with many sections. ESG design trends should make movement through the report intuitive, not decorative.
Another trend is layered information. Not every reader needs the same level of detail. Some readers want executive summaries, while others need technical disclosure. A well-designed report can serve both by using overview pages, expandable digital sections, detailed tables, appendix references, and concise callouts. This creates a better reading experience for diverse stakeholders.
Accessibility is also becoming a stronger design concern. Digital reports should consider readable font sizes, sufficient contrast, logical heading order, meaningful chart labels, and searchable text. Accessibility is not only a technical requirement; it is part of responsible communication. If sustainability information is difficult to read or navigate, the report may fail to serve its audience.
ESG report design trends Singapore companies should also apply to data-heavy appendices. Appendices are often overlooked visually, but they contain important information such as framework indexes, methodology notes, emissions tables, and governance details. Clean tables, consistent labels, and clear references can improve credibility.
Sustainability report trends now show that impact depends on usability. A report that looks premium but is hard to understand may not build trust. A report that is structured, accessible, visually consistent, and evidence-led can create stronger stakeholder confidence. Reporting design trends should therefore support both presentation quality and practical communication value.
Climate Report Design Trends For Emissions And Transition Communication
Climate report design is becoming one of the most important areas within ESG report design trends Singapore companies need to understand. Climate-related information is often technical, but stakeholders need it to be clear. Companies may need to communicate emissions data, climate risks, energy performance, transition planning, governance oversight, and future targets. If this information is presented poorly, readers may find it difficult to evaluate the company’s readiness.
One trend is clearer emissions visualization. Instead of placing emissions data only in dense tables, companies are using charts, source breakdowns, progress trackers, and explanatory notes. Scope 1, Scope 2, and Scope 3 categories may be shown in separate visual blocks so readers understand what each category covers. ACRA’s reporting roadmap confirms that Scope 1 and Scope 2 greenhouse gas emissions reporting applies from FY2025 for all listed companies, while other climate disclosure requirements follow phased timelines.
Another trend is transition roadmap design. A transition roadmap can show near-term actions, medium-term milestones, and long-term ambitions. This is useful for explaining energy efficiency, renewable energy sourcing, supplier engagement, operational adaptation, product innovation, or emissions reduction planning. The roadmap should be realistic and evidence-based rather than purely aspirational.
Climate risk visualization is also growing. Companies can use risk matrices, heat maps, value chain diagrams, and scenario timelines to explain physical risks and transition risks. IFRS S2 focuses on disclosures about climate-related risks and opportunities that are useful to users of general purpose financial reports when making decisions about providing resources to an entity. This makes decision-useful climate communication important.
ESG innovation design should help readers understand climate information without oversimplifying it. If data coverage is incomplete, methodology is evolving, or targets depend on future actions, the report should explain this clearly. A modern climate section should be visual, structured, and honest. Good design supports confidence by making technical information easier to interpret.
Data Visualization Trends For ESG Metrics And Performance Clarity
Data visualization is at the centre of modern sustainability report trends because ESG reports contain more metrics than ever before. Companies need to present emissions, energy, water, waste, employee development, safety, diversity, governance, supplier screening, and target progress in ways that stakeholders can understand quickly. This is why ESG data visualization is no longer optional for high-quality reports.
One trend is using fewer but stronger visuals. Older reports sometimes filled pages with charts that did not add much value. Newer ESG design trends emphasize purpose. Each chart should answer a clear question. Did emissions increase or decrease? Are targets on track? Which material topics are most important? How is governance structured? Which workforce metrics changed year on year?
Another trend is combining visuals with short interpretation. A chart alone may show a trend, but readers still need context. For example, higher energy use may reflect business growth, new facilities, or expanded reporting boundaries. Lower emissions may reflect efficiency improvements, renewable energy procurement, or changed operations. ESG data storytelling connects the visual with meaning.
Sustainability report trends also include metric cards and visual summaries. These are useful for executive summaries, chapter openers, and digital ESG pages. A metric card can show one important number, a comparison, a target status, and a short note. When repeated consistently, metric cards create a strong reporting rhythm.
Designers are also improving tables. Tables should not be treated as plain spreadsheet exports. Clean spacing, readable labels, grouped rows, consistent units, and footnotes can make technical ESG information easier to review. Reporting design trends increasingly recognize that well-designed tables are just as important as charts.
For companies such as alivea and premium corporates, data visualization should support brand quality while preserving accuracy. The goal is not to make numbers look impressive. The goal is to make performance understandable, comparable, and trustworthy.
Materiality Design Trends For Priority Mapping And Stakeholder Focus
Materiality design is evolving because companies need to explain ESG priorities more clearly. A materiality assessment helps identify which sustainability topics matter most to the company and stakeholders. However, the way materiality is presented can affect how well readers understand the report’s logic.
One trend is moving beyond the traditional matrix alone. Many reports still use a materiality matrix, but companies are increasingly adding topic summaries, stakeholder maps, priority clusters, and strategy links. This helps readers understand not only where topics sit on a chart, but also why they matter.
Another trend is grouping topics by theme. Instead of showing a long list of labels, reports may classify material topics under environmental responsibility, people and communities, governance and ethics, customer responsibility, or climate resilience. This makes the information easier to scan and reduces visual clutter.
ESG report design trends Singapore companies can use should also connect materiality to report navigation. If climate risk, workforce safety, and governance are material topics, the report should guide readers to those sections. A simple cross-reference system can improve usability and show that materiality is not just a formal exercise.
Sustainability report trends also emphasize stakeholder visibility. Reports may explain which stakeholder groups were engaged, what themes were raised, and how feedback influenced priorities. This can be shown through diagrams, journey maps, or structured tables. The visual treatment should be concise but credible.
ESG innovation design can also support double materiality discussions where relevant, although companies should use terminology carefully based on applicable reporting frameworks. The key design objective is clarity. Materiality visuals should help readers understand the company’s ESG focus, not create an overly complex graphic.
Strong materiality design improves the entire report. It gives the sustainability story a clear foundation and helps stakeholders see why certain topics receive more attention.
Human-Centred ESG Design Trends For People, Community, And Culture
Human-centred ESG design trends are becoming more important because sustainability is not only about environmental data. Social impact, employee wellbeing, customer responsibility, community engagement, and inclusive governance are also central to ESG communication. Reports that focus only on charts and compliance can feel cold or disconnected. Human-centred design helps make sustainability reporting more relatable while still remaining professional.
One trend is authentic photography. Companies are moving away from generic stock images and toward real workplace, community, customer, and operational visuals where appropriate. Authentic images can make the report feel more grounded. However, photography should not be used as a substitute for evidence. It should support the story, not replace data.
Another trend is people-focused case studies. Reports may include stories about employee development, safety culture, volunteer initiatives, customer service improvements, inclusive hiring, responsible procurement, or community partnerships. A strong case study should explain the challenge, action, outcome, and future relevance. ESG design trends can make these stories easier to read through visual panels, timelines, quotes, and impact summaries.
Sustainability report trends also include better social data design. Workforce diversity, training, safety, engagement, and wellbeing indicators should be shown clearly and respectfully. Social data represents people, so the design should avoid turning sensitive topics into overly decorative graphics.
Human-centred ESG innovation design also improves accessibility and inclusion. Reports should be readable for people with different levels of ESG knowledge. Clear explanations, strong contrast, plain language, and logical structure make reports more inclusive.
For Singapore companies, social communication can support employer branding, customer trust, and stakeholder relationships. Reporting design trends should therefore help companies show both measurable performance and human context. A strong ESG report can communicate responsibility with warmth, clarity, and professionalism.
Governance Design Trends For Accountability, Ethics, And Board Oversight
Governance sections are often among the most text-heavy parts of ESG reports, but modern reporting design trends are making them clearer and more engaging. Governance matters because stakeholders want to understand how sustainability is overseen, who is responsible, and how ESG risks are managed. Good design can make these structures visible without reducing seriousness.
One trend is governance mapping. Instead of describing the board, committees, management, and sustainability teams only in paragraphs, companies can use diagrams that show reporting lines, escalation processes, and accountability structures. This helps readers understand how ESG decisions move through the organization.
Another trend is policy dashboards. Companies may need to communicate ethics, anti-corruption, whistleblowing, data protection, supplier conduct, workplace safety, environmental management, and compliance policies. A dashboard can summarize policy coverage, training, review status, and responsible teams. This is more reader-friendly than long policy lists.
ESG report design trends Singapore companies apply should also show board oversight clearly. SGX guidance places ultimate responsibility for sustainability reporting with the board, while management is responsible for monitoring and managing material ESG factors. Visual governance explanations can help stakeholders see how this responsibility is reflected in practice.
Sustainability report trends are also improving risk communication. Risk matrices, process diagrams, and heat maps can help explain climate risks, operational risks, supply chain risks, ethical risks, and compliance risks. The design should remain balanced and factual.
Governance design should not be overly decorative. It should communicate seriousness, clarity, and accountability. For premium corporate reporting, governance visuals can make the report more accessible while reinforcing trust. A well-designed governance section shows that ESG is not only a communications activity. It is part of corporate oversight and responsible management.
Accessibility And Inclusive Design Trends For Digital ESG Reports
Accessibility is one of the most important reporting design trends for digital ESG communication. A sustainability report should be understandable and usable by a wide range of stakeholders, including people reading on different devices, people with visual limitations, and people who need searchable, structured documents. Accessibility is not a secondary design detail. It supports responsible communication.
One trend is improved contrast and typography. ESG reports often use soft colours, light greens, pale blues, and subtle background textures. While these can look elegant, they may reduce readability if contrast is too low. Modern ESG design trends favour cleaner backgrounds, stronger text contrast, and more legible font sizes.
Another trend is clearer document structure. Headings, subheadings, page numbers, section dividers, and navigation systems help readers move through long reports. For digital PDFs and web pages, logical structure also supports searchability and usability. WCAG 2.2 provides recommendations for making web content more accessible, which is relevant when sustainability information is published online.
Data accessibility is also important. Charts should not rely only on colour. Labels, patterns, captions, and direct annotations can help readers interpret the data. Tables should be readable and not overly compressed. Infographics should include enough text support so meaning is not lost.
Sustainability report trends also include mobile-conscious design. While full ESG reports may still be read mostly on desktop, many stakeholders encounter ESG summaries on mobile devices. Digital report assets should be adaptable for smaller screens.
Inclusive ESG innovation design helps companies reach more stakeholders. It shows respect for the audience and improves the practical value of the report. A beautiful report that is hard to read is not effective. A modern ESG report should be elegant, accessible, and purposeful.
Visual Identity Trends For ESG Reports That Strengthen Corporate Branding
Visual identity is becoming more important in ESG reporting because companies want sustainability reports to feel aligned with their brand. Older reports often used generic green themes regardless of industry. Modern ESG report design trends Singapore companies should follow are more strategic. They connect sustainability content to the company’s identity, market positioning, and communication style.
One trend is brand-integrated ESG colour systems. Instead of using only green, companies may adapt their corporate colours into a sustainability-friendly palette. This keeps the report recognizable while still giving it a distinct ESG tone. The palette should be professional, accessible, and suitable for charts.
Another trend is original iconography. Custom icons can help explain environmental, social, and governance topics consistently. They can be used for material topics, performance dashboards, strategy pillars, and section navigation. Generic icons may work, but custom systems create stronger brand ownership.
Photography direction is also evolving. Companies are using more authentic operational images, employee moments, community engagement visuals, and abstract brand imagery. The best photography feels specific to the company and supports the report’s narrative.
Sustainability report trends also include stronger cover design. ESG report covers are becoming more editorial, minimal, data-led, or concept-driven. A strong cover should communicate seriousness and relevance, not rely on clichés such as leaves, globes, or hands holding plants unless those visuals are used with originality.
For alivea and corporates seeking premium communication, visual identity should make the ESG report feel like part of the wider corporate ecosystem. ESG innovation design should align with annual reports, websites, investor decks, and brand guidelines. Reporting design trends are strongest when they build both sustainability clarity and brand trust.
Alivea Approach To ESG Report Design Trends For Premium Reports
An alivea-style approach to ESG report design trends Singapore companies can adopt should combine strategy, content, data, and design into one professional reporting system. The goal is not to chase every visual trend. The goal is to choose design methods that make sustainability reporting clearer, more credible, and more engaging for stakeholders.
The process should begin with report strategy. Before design starts, the company should clarify its ESG goals, reporting requirements, stakeholder audience, material topics, data availability, and brand positioning. This prevents design from becoming disconnected from substance. A premium ESG report should be built around real information, not visual decoration.
The next step is content architecture. ESG design trends work best when the report has a strong structure. Leadership messages, ESG highlights, materiality, stakeholder engagement, climate disclosure, environmental performance, social impact, governance, targets, and appendices should flow logically. Good structure makes design more effective.
Data visualization should then be developed as part of the design system. Dashboards, charts, scorecards, materiality visuals, governance diagrams, and target trackers should share a consistent visual language. This helps readers compare information across sections.
Sustainability report trends also require digital readiness. Alivea-style reporting can prepare assets for PDF reports, web summaries, investor presentations, and social media highlights. This makes ESG content more reusable while maintaining brand consistency.
Finally, every design choice should support trust. ESG innovation design should not exaggerate performance or hide complexity. It should make data easier to understand, disclosures easier to navigate, and strategy easier to evaluate. For corporate brands, this approach turns the ESG report into a premium communication asset that supports credibility, stakeholder engagement, and long-term reputation.
Future ESG Reporting Design Trends For Singapore Companies
Future reporting design trends will likely continue moving toward integrated, digital, and data-led ESG communication. Companies will need reports that are not only visually attractive but also connected to governance, strategy, climate readiness, and stakeholder decision-making. This means ESG design teams must understand both corporate communication and sustainability disclosure.
One future trend is stronger integration between annual reports and ESG reports. Investors increasingly look at sustainability as part of business performance, not a separate topic. Companies may therefore align ESG report design with financial reporting, corporate strategy, risk discussion, and investor communication.
Another future trend is real-time or regularly updated ESG content. While formal reports may remain annual, companies may use websites and dashboards to share updated sustainability information throughout the year. This requires strong content governance and consistent visual systems.
Artificial intelligence may also influence ESG report production, especially in content organization, data checking, translation, summarization, and design adaptation. However, companies will still need human review, subject expertise, and governance controls. ESG information is sensitive, and accuracy must remain the priority.
Sustainability report trends will also place more emphasis on assurance readiness. As data quality expectations rise, reports may need clearer methodologies, evidence trails, and review documentation. Design can support this by making methodologies, definitions, and boundaries easier to locate.
For Singapore companies, the future of ESG report design is practical innovation. Reports should become easier to read, easier to verify, easier to reuse, and more aligned with stakeholder needs. The strongest design trends will be those that improve trust, not those that only look new. Recommended reading trusted esg report agency singapore for professional reporting design.
What Are ESG Report Design Trends Singapore Companies Should Know Today?
ESG report design trends Singapore companies should know today include digital-first layouts, clearer data visualization, executive dashboards, accessible report structures, branded ESG visual systems, climate disclosure graphics, and stakeholder-focused storytelling. These trends help companies communicate sustainability information more clearly while maintaining professional credibility.
Modern ESG design trends are not only about making reports look attractive. They are about helping stakeholders understand material topics, climate data, governance responsibilities, performance metrics, and future targets. Sustainability report trends now favour structured summaries, readable charts, consistent navigation, and evidence-led storytelling.
ESG innovation design also supports multi-channel communication. Report content can be adapted for websites, investor pages, presentations, internal updates, and social media highlights. Reporting design trends are strongest when they improve usability, transparency, and trust. For companies such as alivea and corporate brands in Singapore, these trends can help transform ESG reporting into a premium communication asset.
Who Should Follow ESG Design Trends For Better Sustainability Reporting?
ESG design trends should be followed by listed companies, large private enterprises, multinational groups, investor-facing businesses, sustainability teams, annual report teams, corporate communications departments, and brands that want stronger stakeholder trust. Any company that publishes ESG information can benefit from clearer report design.
Sustainability managers need design trends to communicate complex data more effectively. Investor relations teams need clear reporting formats to explain risks, targets, and performance. Corporate communications teams need branded ESG storytelling that aligns with reputation goals. Designers need sustainability report trends to create layouts that support disclosure rather than distract from it.
ESG report design trends Singapore companies use should also involve leadership, finance, legal, risk, operations, and human resources teams. These departments provide data and review important claims. ESG innovation design works best when it is supported by accurate information, clear governance, and professional communication planning.
Where Do Sustainability Report Trends Improve Corporate Communication Most?
Sustainability report trends improve corporate communication most in executive summaries, climate sections, materiality pages, data-heavy performance chapters, governance explanations, stakeholder engagement content, and digital ESG channels. These areas often contain complex information that benefits from strong visual structure.
In executive summaries, reporting design trends help readers understand the main story quickly. In climate sections, ESG design trends make emissions, risks, and targets easier to interpret. In materiality pages, visuals help explain stakeholder priorities. In governance sections, diagrams can show accountability and oversight more clearly.
ESG report design trends Singapore companies use can also improve websites, investor presentations, recruitment content, and internal communication. ESG innovation design allows approved sustainability information to be reused without losing clarity or consistency. When design is applied across channels, the company’s ESG message becomes easier to find, understand, and trust.
When Should Reporting Design Trends Be Applied During ESG Report Planning?
Reporting design trends should be applied early in the ESG report planning process, not only after all content is written. Early design planning helps companies decide which sections need dashboards, charts, case studies, icons, timelines, digital assets, or interactive elements.
If design begins too late, the report may become a formatting exercise rather than a strategic communication tool. ESG report design trends Singapore companies use are most effective when writers, designers, sustainability teams, data owners, and reviewers work together from the start. This allows the team to plan page structure, data visualization, image direction, and digital outputs before deadlines become tight.
Sustainability report trends should guide content collection as well. If a dashboard is planned, data owners know which metrics are needed. If a case study layout is planned, teams know what evidence to provide. ESG innovation design works best when it supports the full reporting workflow.
Why Does ESG Innovation Design Matter For Stakeholder Engagement?
ESG innovation design matters because stakeholders need sustainability information that is clear, credible, and easy to use. A traditional text-heavy report may contain valuable information, but readers may struggle to find or understand it. Innovative design helps transform complex disclosure into a more engaging and useful experience.
ESG design trends such as dashboards, visual summaries, interactive charts, materiality maps, governance diagrams, and digital report pages help stakeholders access information faster. Investors can review performance and risks. Employees can understand workplace commitments. Customers can see responsible practices. Regulators and partners can evaluate disclosure quality.
However, ESG innovation design must remain responsible. It should not exaggerate achievements or hide challenges. Sustainability report trends are most valuable when they support transparency. ESG report design trends Singapore companies adopt should help explain what changed, why it matters, and what the company will do next. This strengthens stakeholder engagement and trust.
How Can Companies Use ESG Design Trends Without Losing Reporting Accuracy?
Companies can use ESG design trends without losing reporting accuracy by starting with verified data, clear content structure, and strong review processes. Design should support information, not reshape it in a way that changes meaning. Every chart, dashboard, infographic, and case study should be based on approved data and reviewed by relevant teams.
ESG report design trends Singapore companies apply should include clear labels, units, captions, methodology notes, and source consistency. Sustainability report trends such as visual storytelling and digital adaptation should not remove important limitations or context. If data boundaries are evolving, the report should explain that clearly.
ESG innovation design should also involve sustainability, finance, legal, communications, and management review before publication. Reporting design trends can make reports more attractive and readable, but accuracy must remain the foundation. When companies combine strong design with disciplined disclosure, they can create ESG reports that are both modern and trustworthy.
Building Modern Corporate Trust Through ESG Report Design Trends Singapore
ESG report design trends Singapore companies should follow are ultimately about building trust through clearer, smarter, and more accessible sustainability communication. Modern ESG reports need to do more than look professional. They must help stakeholders understand strategy, material topics, climate performance, social impact, governance accountability, risks, targets, and future commitments.
The strongest ESG design trends focus on usability. Executive dashboards help readers scan important information. Data visualization makes performance easier to compare. Digital-first layouts improve access across websites, PDFs, and investor channels. Accessible design helps more stakeholders engage with the report. Brand-integrated visual systems make the report feel connected to corporate identity. ESG innovation design brings these elements together into a more effective communication experience.
Sustainability report trends also show that design and disclosure must work together. A beautiful report without evidence may reduce credibility. A technically accurate report without clear design may fail to engage readers. The best reporting design trends support both clarity and accountability. They make complex information easier to understand without oversimplifying important details.
For Singapore companies, this is especially important as sustainability reporting expectations continue to mature. Climate disclosure, governance oversight, stakeholder engagement, and data quality all require reports that are structured and transparent. Design can help companies communicate these areas with greater confidence.
For alivea and corporate brands seeking premium ESG communication, adopting the right design trends can turn sustainability reports into long-term brand assets. A strong ESG report can support investor relations, employee engagement, customer trust, regulatory confidence, and corporate reputation. It can also help internal teams see ESG priorities more clearly.
The future of ESG reporting belongs to companies that combine strategy, evidence, design, accessibility, and storytelling. When ESG report design trends Singapore companies apply are chosen with purpose, the final report becomes more than a document. It becomes a credible platform for transparency, responsibility, and sustainable corporate growth.
